Background
The price of oil is a major factor in the overall health of the energy sector and is one of the most heavily traded commodities as it is influenced by almost every global, macro event. Besides being one of the most actively traded commodities, the price of crude oil is extremely sensitive to geopolitical and weather events.
Majorly, there are two popular grades of oil – Brent Crude & WTI (West Texas Intermediate) Crude oil. The major difference between the two is that Brent Crude originates from oil fields in the North Sea between the Shetland Islands and Norway, while WTI is extracted from oil fields in the United States. It is primarily extracted in Texas, Louisiana and North Dakota and is then transported via pipeline to Cushing, Oklahoma for delivery.
OPEC, a group of 14 of the most powerful oil-exporting countries, use Brent as their pricing benchmark. WTI is a preferred measure and pricing model for the US.
Crude Oil Price History
Let me explain that why there is price divergence between Brent crude & WTI crude and why WTI should be costlier than Brent.
The world crude oil market is all about investor anticipation of supply and demand, and oil prices are very volatile and highly influenced by consumer and investor sentiment.
WTI oil has a higher API gravity (American Petroleum Institute gravity – a measure of how heavy or light a petroleum liquid is compared to water) then Brent oil. The gravity of the oils is rated on a scale from 10 to 70, where the higher the number the less dense the oil & easier to refine. To put this in perspective, if the API is higher than 10 the oil will float on water and if it is lower than 10 the oil will sink. WTI’s API gravity is 39.6 and Brent’s API gravity is 38. Both Brent and Crude are relatively light oils where WTI is easier to refine than Brent.
WTI has a sulfur content of 0.24%, Brent has a sulfur content of 0.37%. The lower the sulfur content of the oil, the “sweeter” the oil and the easier it is to refine. Both WTI and Brent are considered sweet crude. Thus, it makes WTI easier to refine and it is also good for the environment point of view.
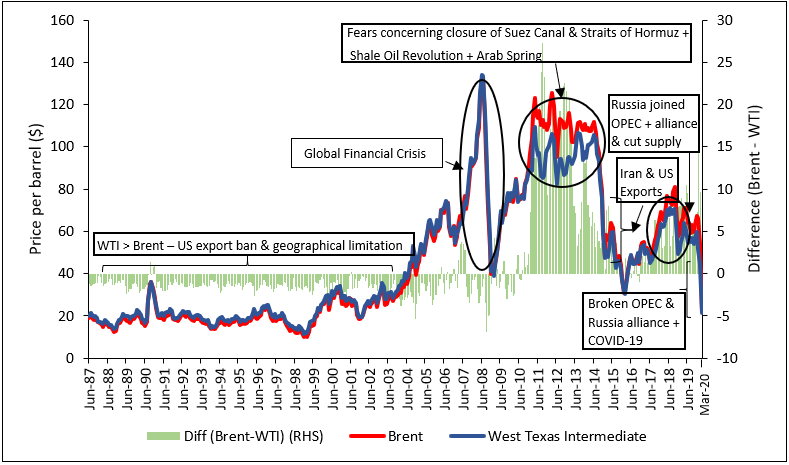
Therefore, WTI should be costlier than Brent, as it was before 2010 but after 2010 price difference between WTI and Brent changed dramatically.
Before 2010 –
WTI was extracted from landlocked states therefore it doesn’t have any seaport connectivity so that oil can be export to other countries thus made WTI costlier to export. During this period, US used to import oil from Venezuela and Middle East countries. Then US used to blend oil from these countries with domestically produced WTI and all oil Refineries were designed accordingly. Moreover, there was a law in US passed in the 1980s, according to that law, US cannot export oil to other countries. Thus, made WTI costlier (US produced less hence costly).
After 2010 –
World oil scenario changed suddenly as US started to produce oil from Shale formations (named shale oil). This oil was having almost zero sulfur content and was as lighter as WTI. During this time Shale oil production was increasing at incredible speed. Due to the abundance of shale oil in US, WTI Price started to decrease substantially (even below Brent be oil).
The spread widened during 2011 with Brent trading at a premium compared to WTI. Around the time that the Arab Spring (protests among several largely Muslim countries, including Tunisia, Morocco, Syria, Libya, Egypt and Bahrain) began in Egypt which concerned about the supply of crude, the spread widened.
Fears concerning the closure of the Suez Canal and a lack of available supply caused Brent crude oil to become more expensive than WTI. As tensions eased over the canal’s operation, the spread reduced.
Then, in late 2011, the Iranian government threatened to close the Straits of Hormuz, through which approximately 20% of the world’s oil flows each day. Once again, the spread widened, as Brent soared to $25-$27 premium per barrel higher than WTI.
In 2015, a premium drop for Brent occurred for two reasons. First, an agreement with Iran was there allowing the country to export more oil, which should have increased the amount of Iranian crude flowing into the market on a daily basis. Since Brent is the pricing benchmark for Iranian crude, this depressed the price of Brent at the time.
Second, US government passed a law in 2015, which allowed US to export oil to other countries. They started to build pipelines like CACTUS 2 (a 925km (575 miles)-long oil pipeline system passing through the Permian Basin in the US) and ports like Louisiana port to facilitate export and Transportation. But the irony is U.S. rig counts dropped at the same time that meant less drilling in the future and less U.S. production on a daily basis.
Therefore, Brent prices moved lower by virtue of hints of more Iranian crude and WTI strengthened because of less U.S. production and increasing exports.
What happened to the price since Jan?
Since Jan, the crude is down as much as 60%.

In 2016, Russia joined the OPEC alliance after the oil plunges to $30 a barrel. This raised & stabilized the price in the range of $55-$70 a barrel. But, recently in March’20 Russia refused to go along with the plan of Saudi Arabia to reduce the production to prop-up the price. Saudi Arabia wanted to do so because, due to the effect of COVID-19, jet fuel-gasoline-diesel consumption has taken a hit. All trading activities are on edge. The global economic outlook has taken a hit. This reduced the price of oil.
The denial hit hard on the grounds of Saudi & other OPEC. After this Saudi started the price war. They started selling oil at deep discounts. They’ve also threatened to flood the markets with oil in the coming days. Keeping the oil taps open in these days is really threatening. Will this bring Russia on the negotiating table? We don’t know.
Let us now understand how India will benefit out of it & what lies ahead.
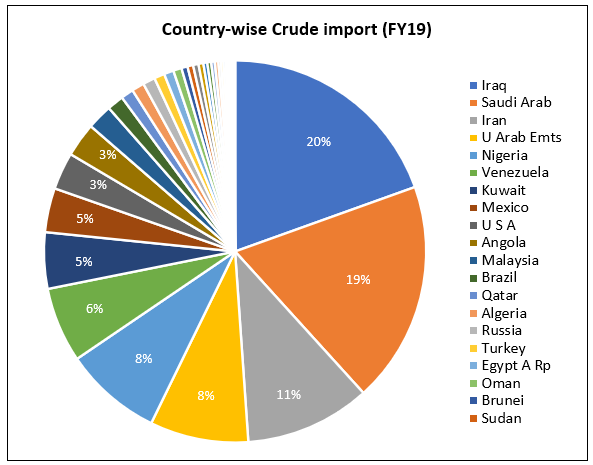
Which of those India imports? WTI or Brent? From where?
India prefers oil that is linked to Brent. Brent is costlier than WTI but India doesn’t switch because of inland movement and a long ocean voyage involved in buying American crude oil narrow down the price difference to a point where it is not worthwhile.
Importance of Crude oil for India
Being one of the largest importers of crude oil, it is very important to understand the dynamics of India. Let me share some data points which will prove the importance of crude oil for India.
How much oil India imports as a % of total imports?
Source (Oil imports): RBI
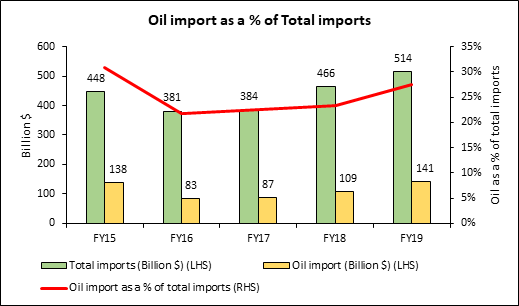
India oil import bill is 30% of the total import bill. India buys $9-$11 billion oil on a monthly basis (dividing the total oil import by 12). If we assume that India bought $10 billion in Jan’20-Feb’20-Mar’20 (each month), then a 60% fall in the crude results in about$10-15 billion savings in just 3 months! Just imagine if this draw-down in oil price continues for a long time.
How much oil did India produce & imports?

The dependency on imported crude increased drastically over the years. We are producing less oil and depending more on imports to meet domestic requirements. From 35% of imported crude oil in 1984, it doubled to 70% in 2001. Just 20% fall in crude price will bless India with a $28 billion saving which is about 1% of GDP.
Now, since the last 4-5 years, we import about 85%-87% of the crude oil. As India imports more, lower prices act as a big incentive as the country.
Crude relation with Fiscal Deficit

There’s no clear benefit seen in the CAD as there are many other factors which affect CAD. Let me add one more variable which will make the data somewhat sensible.

Source (Oil exports): RBI
Now, we know that out of the total imports, about 30% is oil. Out of the total exports, about 10-15% is oil. Thus, approximately a deficit of 20-15%. If we calculate the absolute amount i.e. 15% of the fiscal deficit, it would be about $12-13 billion which is about 0.5% of GDP.
Why the impact is not there in retail prices?
Weak rupee offsets some gains – Since Jan’20, the value of rupee got depreciated by about 5%-6%. As we buy a large part of our oil using dollars, rupee offsets some of the lower crude price gains.
Government’s will – It is a possibility that the government might not choose to pass on the lower prices to the consumers. In my opinion, this is not the right move. Lower petrol & diesel price will directly translate to more money in people’s hands. This will, indeed, improve consumption & seeing the current scenario this seems to be the correct measure.
Remember October 2018 announcement of the Government. It stated that there would be a reduction of ₹2.5 per litre on petrol & diesel. Of which, Centre took ₹1.5 (excise duty reduction) cut & Oil Marketing Company took ₹1 cut. This type of move may happen again.
Which countries are stacking the inventories of oil at such a low rate?

China is benefiting the most. India is not piling up the inventory until this news came on 20th Mar’20 which states that India will buy ₹5,000 crores or $670 million at the price of $30. The delivery of oil will start from April-May. This is a good move as it will benefit India in this pandemic time.
We don’t have the exact data of inventories for India. Only US gives the exact data of crude inventory because it has proper petroleum reserve with a capacity of more than 710+ million barrels. India has relatively very less capacity as of now & a majority of the capacity is with the port storage tanks & the refineries where crude is processed.
Is there any benefit in buying Brent crude futures?
Let me share a table.
| Contract Month | Price | Volume |
| Jun’20 | $ 29.98 | 5,91,561 |
| Jul’20 | $ 31.90 | 2,61,769 |
| Aug’20 | $ 33.41 | 1,72,422 |
| Sep’20 | $ 34.60 | 1,46,794 |
| Oct’20 | $ 35.44 | 90,303 |
| Nov’20 | $ 36.08 | 63,683 |
| Dec’20 | $ 36.51 | 2,19,032 |
| Jan’21 | $ 36.93 | 19,239 |
| Feb’21 | $ 37.43 | 15,660 |
| Mar’21 | $ 38.76 | 18,924 |
| Apr’21 | $ 38.52 | 4,738 |
| May’21 | $ 38.71 | 3,393 |
| Jun’21 | $ 38.90 | 47,185 |
| Aug’21 | $ 39.55 | 1,197 |
| Nov’21 | $ 41.23 | 821 |
| Dec’21 | $ 40.43 | 57,707 |
| Mar’22 | $ 42.50 | 165 |
| Jun’22 | $ 42.05 | 7,226 |
| Dec’22 | $ 43.19 | 12,923 |
| Jun’23 | $ 44.92 | 1,136 |
| Dec’23 | $ 46.62 | 2,736 |
| Dec’24 | $ 48.50 | 241 |
In the shorter run too, as we can see from the table that the market is expecting oil to rebound to the level of 35-38.
If we even see 1-year futures from now i.e. Apr’21 contract which is quoting at $38.52 but it has low volumes. Jun’21 is quoting at $38.9 which has decent volumes. If we see for Dec’21 futures, it is quoting at $40.43 which has decent volumes.
The volumes are very less after Dec’21. After that, only Dec’22 has above 10k volumes.
Yes, futures will benefit if we see for 1/1.5/2 years. We will not get as cheap as today because forward prices are heavily in contango. Then too, as we know that even a few dollars savings will benefit India a lot. The real challenge for India is to maintain & utilize the inventory in the best possible way.
Conclusion
Thus, oil prices have been under pressure due to the demand growth concerns from the outbreak of COVID-19 (demand-side pressure) & the broken alliance of Russia & OPEC (supply-side pressure).
The current level of $25-30 per barrel oil will imply an operational loss for many high-cost producers around the world which eventually reduce the supply. But, the demand-side concern (COVID-19) is uncertain & we don’t know how long it will last?
Indeed, India will benefit from this shock for a short period of time.

An interesting and superbly written article. Much appreciated
LikeLike
Thank you so much 🙂
LikeLike